© 2020 ROI Hunter
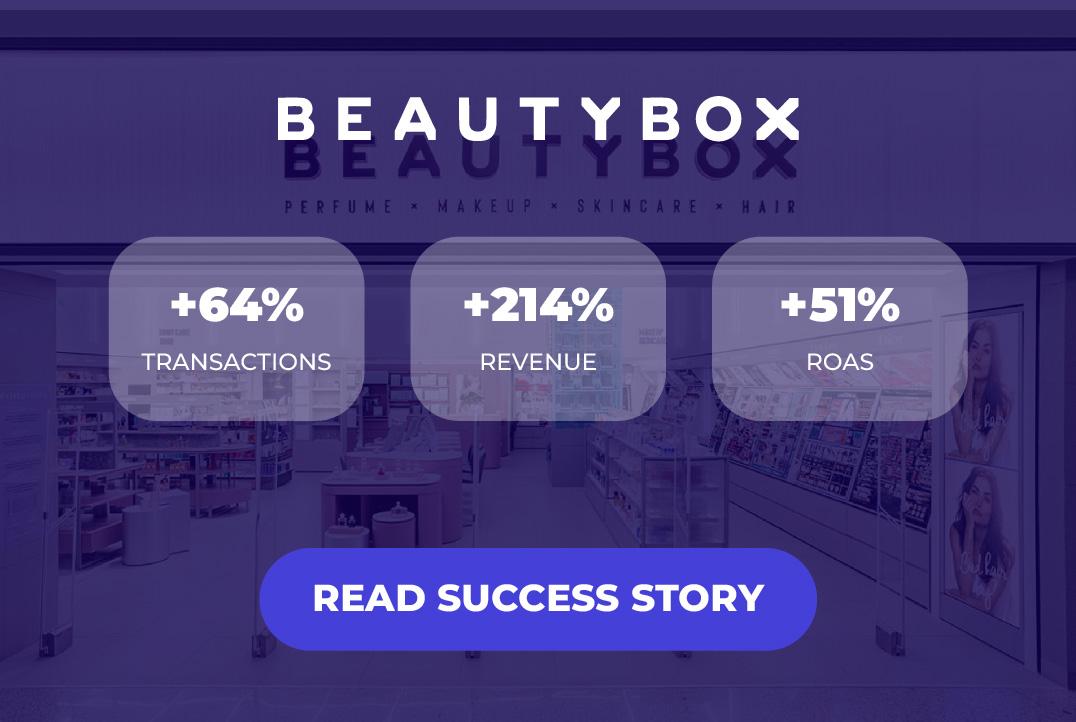
+25.5%
REVENUE
+25.4%
ROAS
-59%
CPA
+18%
Incremental ROAS
+44%
INCREMENTAL CONVERSION RATE
+23%
INCREMENTAL CONVERSIONS
+6.7%
return on ad spend
+6.5%
NEW CONVERSIONS
-6.3%
CUSTOMER ACQUISITION COST
+76%
return on ad spend UPLIFT
+98%
REVENUE generated PER AD SET
-23%
Effective cost per action
+26%
AVG. ROAS UPLIFT ACROSS 3 BRANDS
+10%
AVG. CTR UPLIFT ACROSS 3 BRANDS
-10%
AVG. CPC DROP ACROSS 3 BRANDS
2.25x
META ROAS
-70%
SPEND ON POOR PERFORMERS
+30%
SPEND ON BESTSELLERS
+13.15%
+9.4%
GA4 ROAS
-3.3%
COST PER PURCHASE
+17%
CONVERSIONS
-15%
COST PER ACTION
+236%
Meta Dynamic Ads Revenue
Meta Dynamic Ads PRODUCT ROAS
+69%
Meta Dynamic Ads Spend
+124%
roas
+94%
average sale price
+8%
total sales
3
weeks
+75%
-38%
cost per purchase
+92%
meta ad spend
+377%
meta revenue
+150%
meta roas
PMAX Cost
+198%
revenue
PMax Return on Ad Spend
+73%
+14%
GROSS PROFIT
+19%
AVERAGE SALE PRICE
4
MONTHS
10%
OF TOTAL BUDGET SAVED
+262%
-14%
RETURN RATE
+11%
RETURN ON AD SPEND
GA REVENUE
-17%
AD SPEND
+67%
SESSIONS
+82%
Conversion Rate
-21%
Cost per acquisition
+20%
Return on ad spend
+130%
Google Analytics return on ad spend
-22%
Facebook Cost per acquisition
+51%
Facebook Click-through rate
increase in return on ad spend
+33%
increase in click-through rate
decrease in cost
+47%
Return on Ad Spend
-33%
Cost per Sale
-32%
Cost Per Acquisition
8
days for results
+21%
HIGHER RETURN ON AD SPEND
LOWER COST PER ACQUISITION
+105%
HIGHER CONVERSION RATE
-30%
AVERAGE CAMPAIGN COST
HIGHER CLICK-THROUGH RATE
+72%
+93%
+101%
+395%
higher revenue
+466%
+254%
more app installs
+9x
CTR
+326%
-80%
+54%
Google Analytics Transactions
+28%
Google Analytics Conversion Rate
+83%
Google Analytics ROAS
+116%
Incremental Purchases
-49%
Cost Per Purchase
+587%
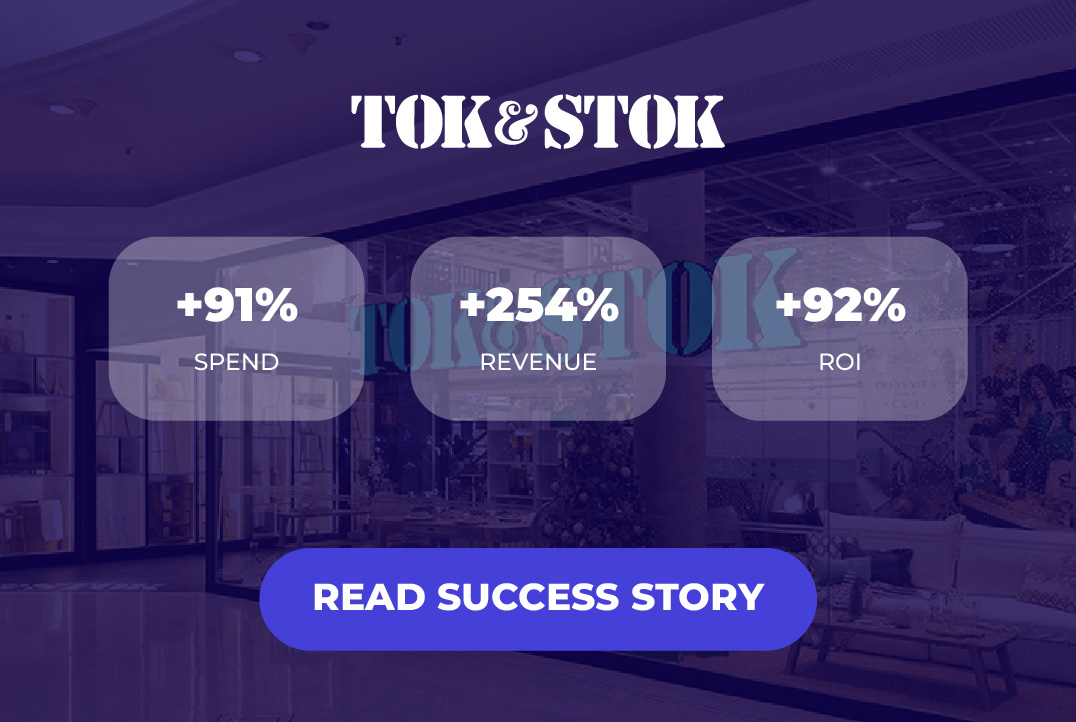
+24%
ROI
+42%
SPEND
+323%
Revenue
+459%
TRANSACTIONS
+45%
More New Users
More Transactions
+66%
More Revenue
+85%
Average Order Value
Higher ROAS
-16%
Lower CPM
Lower CPC
+89%
Click-through rate
+339%
Spend
Click-through Rate
-40%
+36%
Transactions
+35%
21%
Increase in click-through rate
76%
Increase in conversion rate
107%
Increase in ROAS
596%
Increase in conversions
318%
22%
Lower cost per action
61%
Increase in revenue
72%
115%
Higher return on ad spend
33%
28%
Lower cost per click
1 Month
Campaign
289%
Increase in Revenue
328%
+38%
more transactions
-25%
cost per transaction
+49%
higher roas
+119%
FB ROAS
+71%
higher ROAS
+29%
1000+
Stores
+210%
Increased Conversions
+27%
-52%
CPC
+63%
<1
month
+62%
+74%
-87%
+515%
+107%
GA Revenue
1
Month
+7%
+164%
+214%
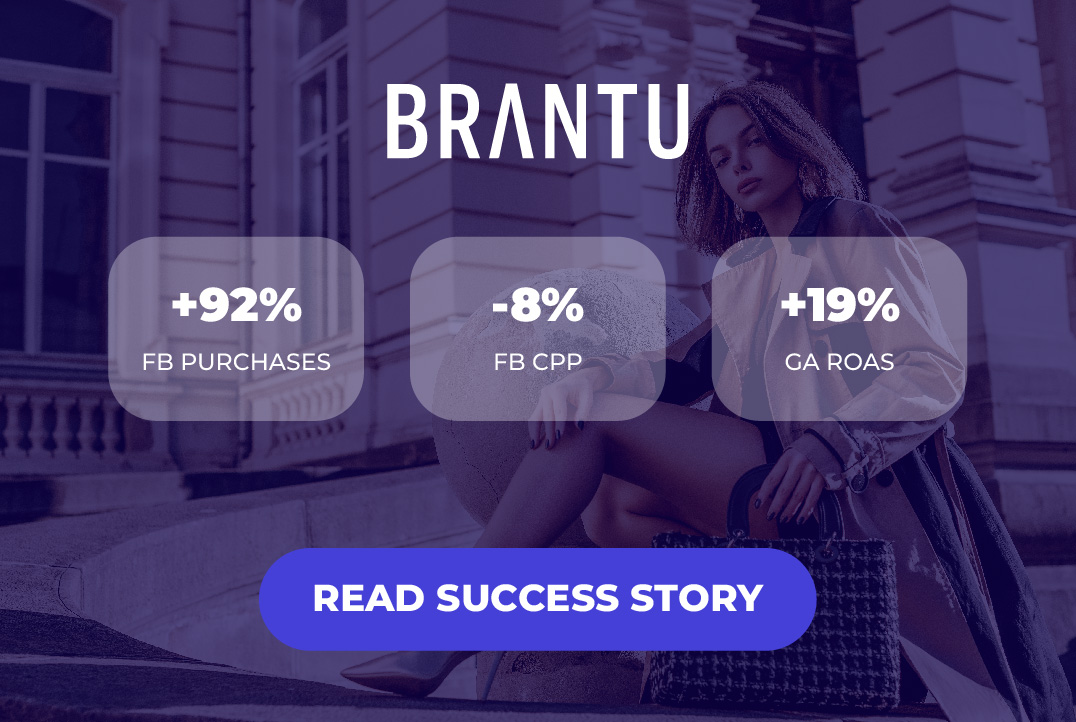
92%
Higher FB Purchases
8%
Lower FB CPP
19%
Higher GA ROAS
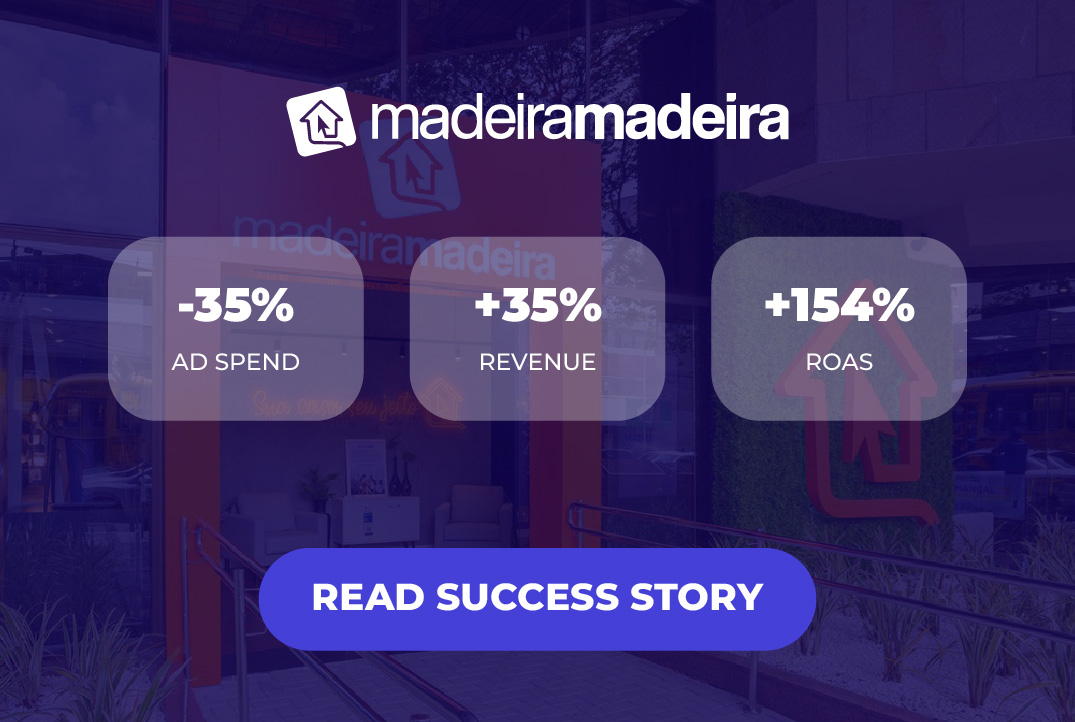
-35%
Ad Spend
+154%
+91%
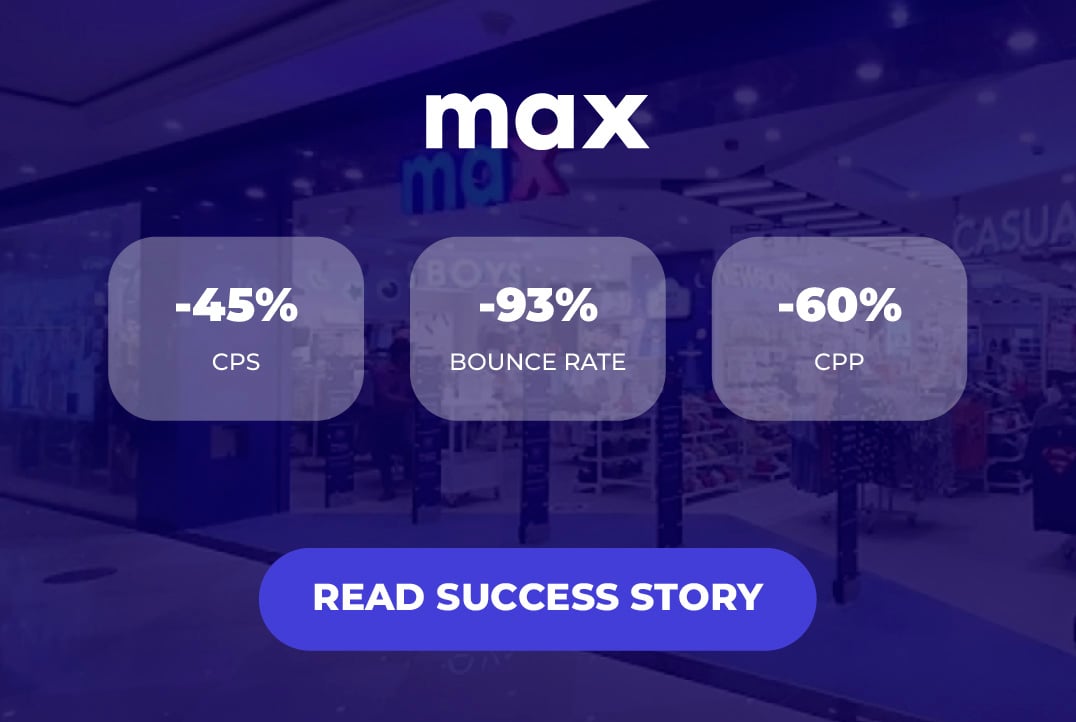
45%
lower cost per session
93%
lower bounce rate
60%
lower cost per purchase
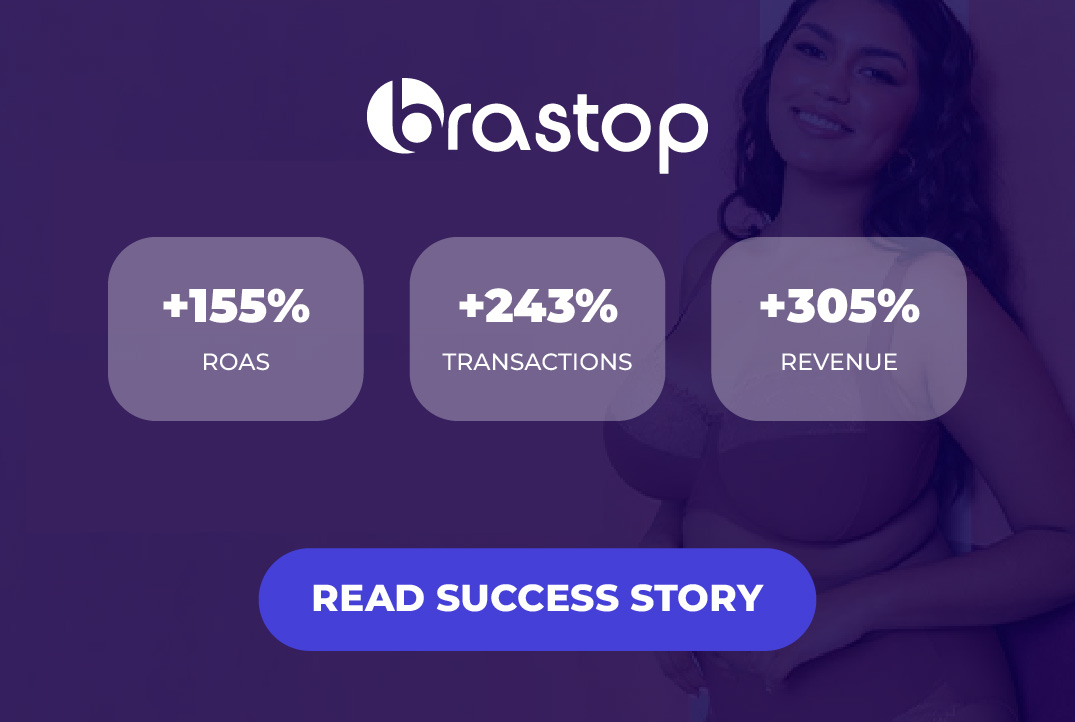
155%
243%
Increase in Transactions
305%
Higher Revenue
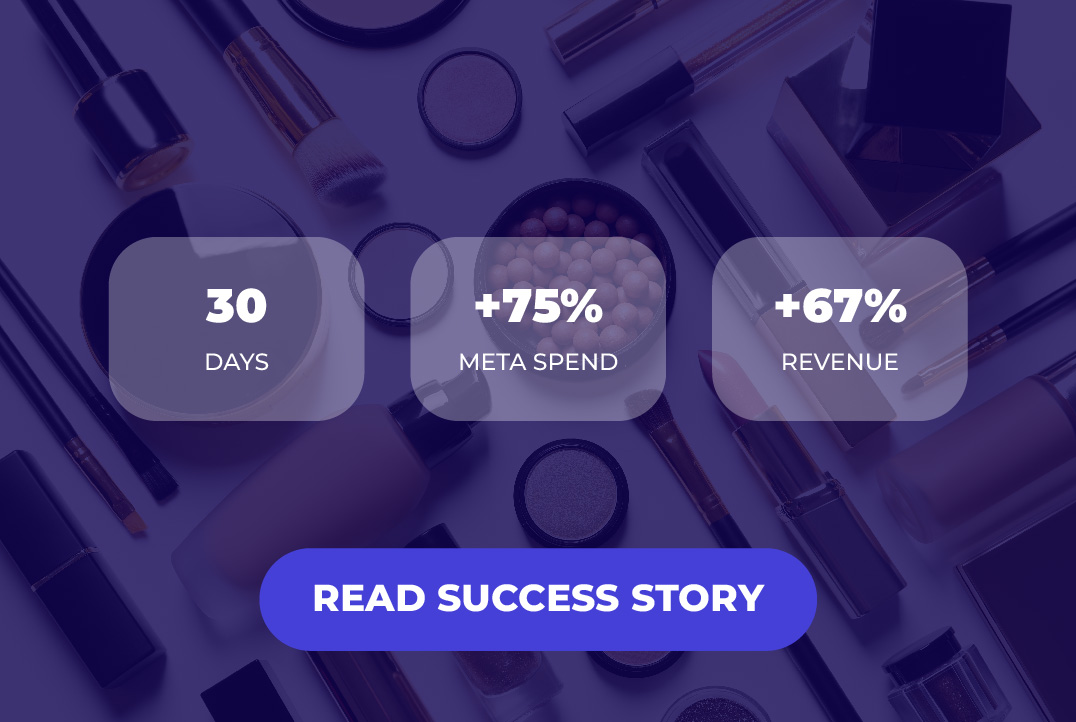
30
Days
+75.2%
FB Spend
Revenue Uplift
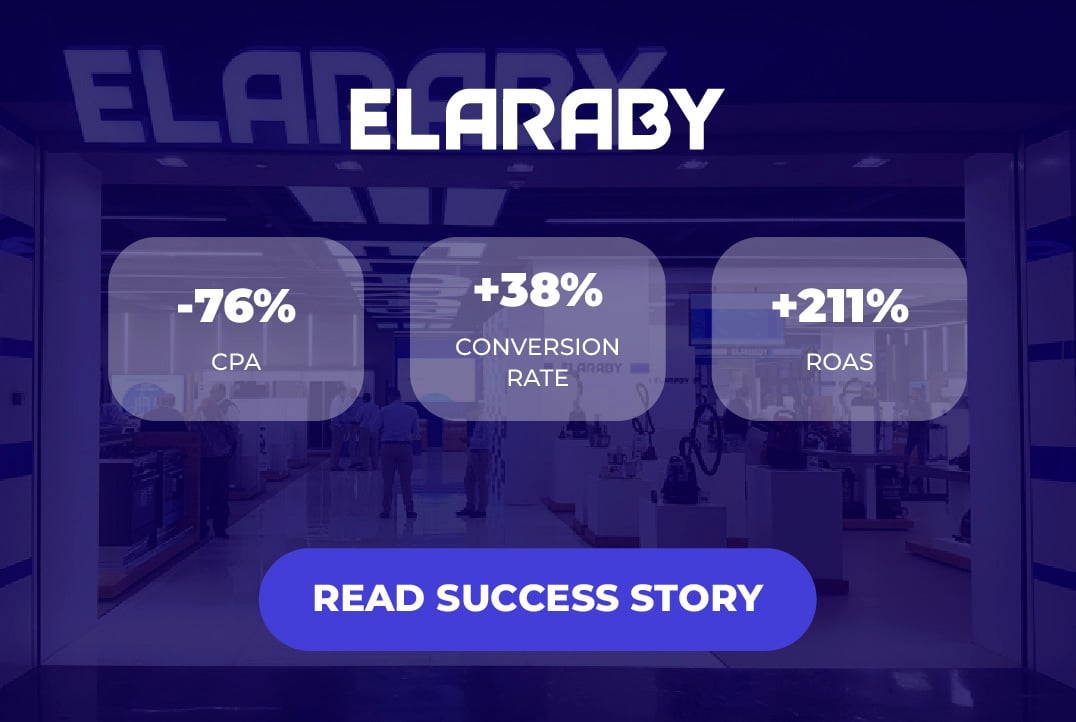
Lower CPA
38%
Higher Conversion Rate
211%
53%
Increase in Spend
420%
Increase in Purchases
249%
70%
Reduction in campaigns
40%
Increase in spend
Increase in ROI
47%
20%
122%
Higher CTR
94%
HIGHER CR
25%
LOWER CPO
HIGHER ROAS
Lower Cost Per Transaction
55%
increase in roi
decrease in cac
13%
decrease in cpi
SIMPLE INTEGRATION
+1500%
84%
15%
MORE CONVERSIONS
LOWER CPP
64%
HIGHER REVENUE
700%
130%
INCREASE IN CTR
DECREASE IN CPA
113%
56%
lower cost per transaction
98%
more sessions
3.5x
scale in app install campaigns
24%
better CTRs
6%
Lower CPI for mobile app install campaigns
2x
increase in Ad Spend
7x
4x
increase in roas
3.2X
Increase in CTR
Decrease in CPC
75%
2
Versions of Tests
2.6X
341%
Increase in Conversion Rate
75.4%
Decrease in CPA
83%
46%
52%
58%
37%
decrease in cpt
increase in ctr
reduction COP
more purchases
3x
9.5x
Full
funnel approach
awesome campaign
INCREase in roi for dpa
increase in roi from google analytics
7.4x
roi
99.9%
time reduction
weeks until completion
50%
higher spend
10x
automation
65%
Less time spent
higher roi
categories tested
163%
more revenue from fb
182%
15.8
better overall conversion rate
30%
11%
higher order value