
Motivation
In the last few years, Slack has become a de facto standard internal communication tool for IT-related companies. It’s a lightweight tool that’s clear, easy to work with and has many little helpers that saves you lots of time, such as nice keyboard shortcuts. This article, however, will be about the marvelous options offered by Slack API.
Note that some parts of the images in this article are blurred - that’s done in order to protect privacy of people on those screenshots or sensitivity of the information shown there. It might be an overkill at some points, but we firmly believe in the saying “better safe than sorry”.
As developers, we often like to tinker with the tools at our disposal. Here, we will show you the things we’ve done with Slack, ranging from the first funny attempts to the huge time-saving things we have now.
Early Days
Pranks
We got Slack in the middle of 2015. Shortly after, we began inquiring about what Slack can do. Our first attempts were more of pranks rather than anything else, as shown on the screenshots. The customized Slackbot response for certain things
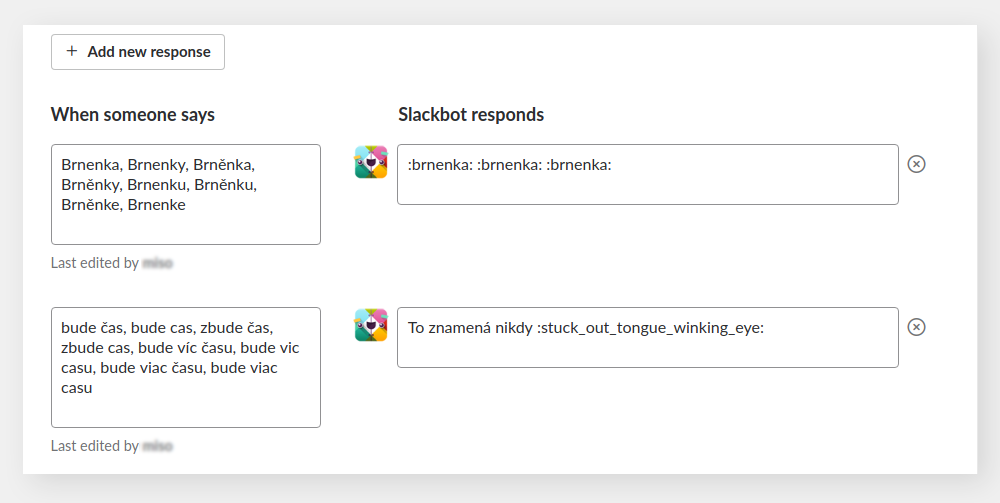
resulted in the following:
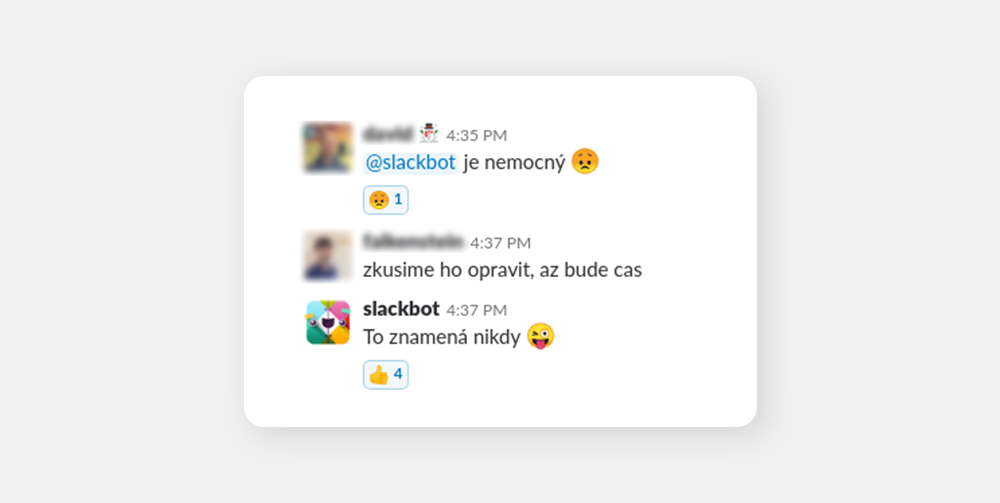
Trigger: “when we have time”. Bot answer: “that means never”. This really started to be fun when our marketing people also started getting these reactions and they thought it was s Slack feature designed to scold them. Fortunately, we soon realized the potential and moved from childish pranks to coming up with ideas that were actually helpful.
Alerts from Graylog
When I look at our infrastructure from the year 2015, it feels pretty much like the stone age. We only had a single core running app back at the time when we were just developing our first microservices. Slack then offered us some nice application state monitoring options as it already was our primary communication tool. First, we configured Graylog, our log management system, to automatically send us messages to Slack when something is wrong.
Graylog sorts incoming logs into streams based on conditions you define. Therefore, we took the stream “Production”, which was receiving all of the logs from our core app and created an alert. Trigger for that alert was easy: when there’s less than one message in the last minute, it alerts us. It also did not alert more than once per 10 minutes. This could work because the app was constantly logging from e.g. crons. For example, if there was no logs in the last minute, it essentially meant that the app was down. You can see the fruits of our first endeavors below:
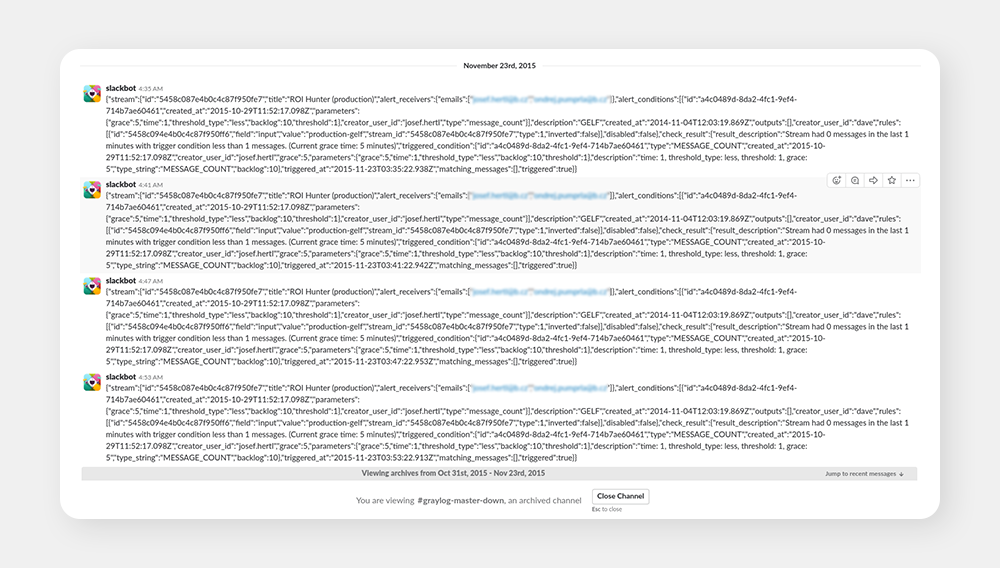
In other words, say hi to our first spambot. After getting a few alerts during the first night, we realized the Slack integration was working fine, but the alerts were completely fake. The reason for this was that the app was running fine and logging fine, but the logs took too much time to arrive and to be indexed, i.e. our server for Graylog was too weak to handle it properly and, thus, we got these fakes.
Note that the form of the original alerts is horrible. We eventually optimized them to look more like this:
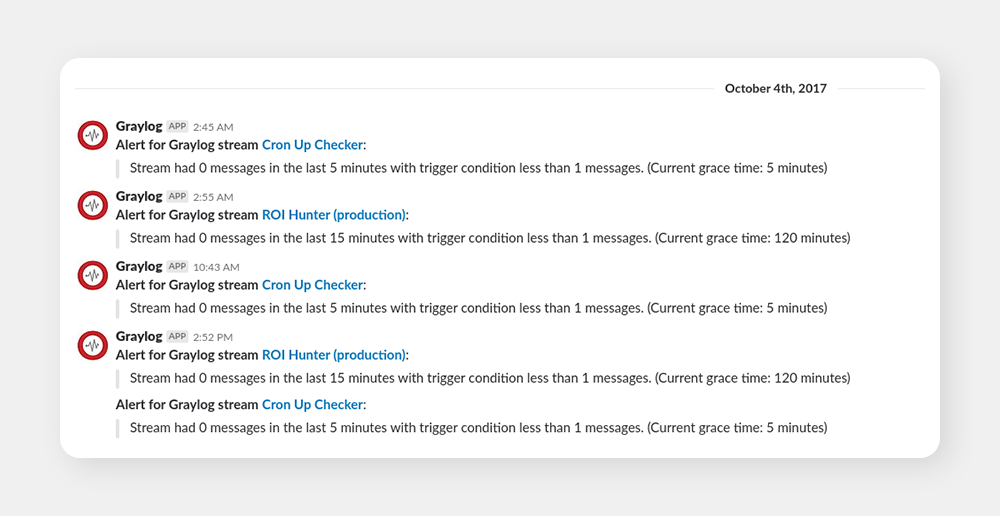
Shortly after, we realized the whole idea of alerting based on presence (or lack thereof) of logs in Graylog wasn’t the best idea. Even though we optimized the process a lot, we still kept getting loads of false alarms, usually because Graylog itself was too slow or down, while the app was running fine. Basically, we added another tool that could mess up the alerts, which it did. We then realized that we need an alerting tool that will take the data directly from our core app.
Zabbix alerts
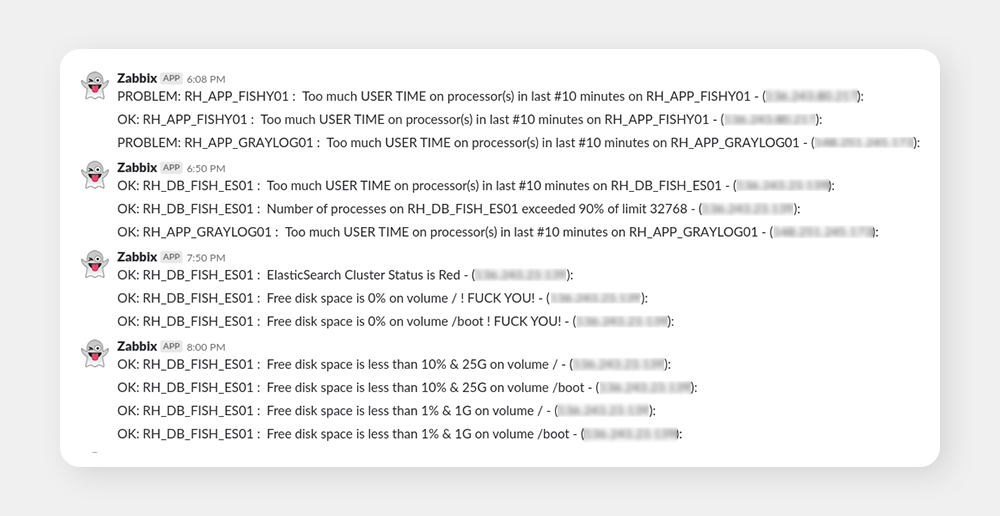
We also had a monitoring tool called Zabbix. It’s more useful for devops than for devel. The first thing we did was to integrate Zabbix to Slack (previously it alerted via email) and set up the alerts to tell us when something horrible happened. See examples of these on the screenshots.
Eventually we also came up with more advanced monitoring of the app via healthchecks, i.e. Zabbix periodically called /health endpoint on our servers and alerted into a specific Slack channel if something was wrong.
While they were not perfect, the alerts from Zabbix helped us tremendously, so we’re forever going to hold some of these alerts in our hearts (also, apologies for the rude language, but it’s rather fitting).
Hekate
Over the past two years, we greatly improved our infrastructure: we added multiple microservices, made the platform far more stable and most importantly we finally automated our deploy process.
Before, our deploy process wasn’t exactly the best because we had to manually build the artifact, upload it and restart the server for the changes to take effect. The new deploy process was much better because it was essentially a blue-green deploy. Therefore, we had two instances - blue and green, one of which was active and the other one was inactive. When the deploy command was given, the inactive instance got taken down, its code swapped for the newly built jar and, when it was ready, we redirected all of the traffic to the new instance where it then became active.
At first, we were controlling this only via Jenkins, but we quickly realized that we are too lazy to always go into Jenkins to deploy every time. Slack was the easy solution here. For this purpose, we developed a simple chatbot called Hekate.
Setup
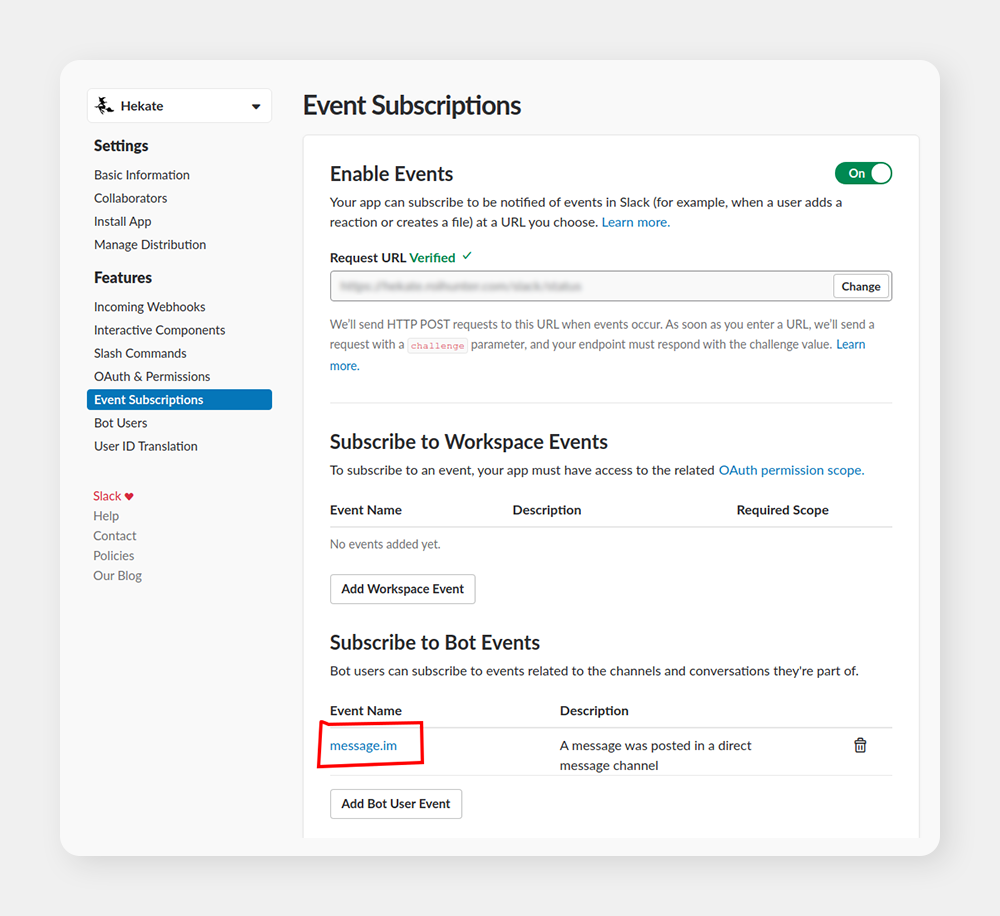
All you need is to set up a Slack app for your workspace and subscribe it to Bot Event, in our case, it was message.im i.e. when a Slack user posts a message directly to the bot. You can configure everything else, including authentication tokens and bot users, in the app UI. Be sure not to forget to install the app so that it shows up on your workspace.
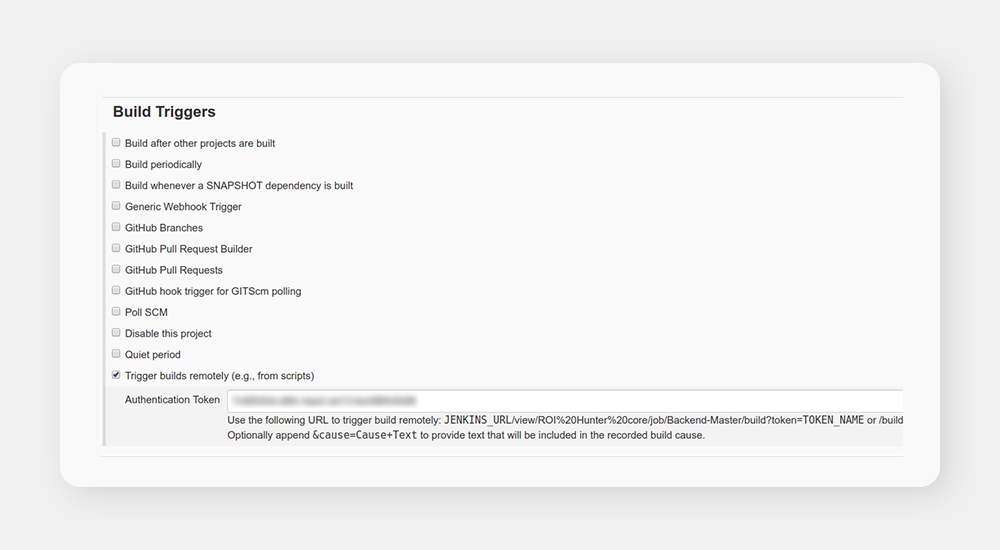
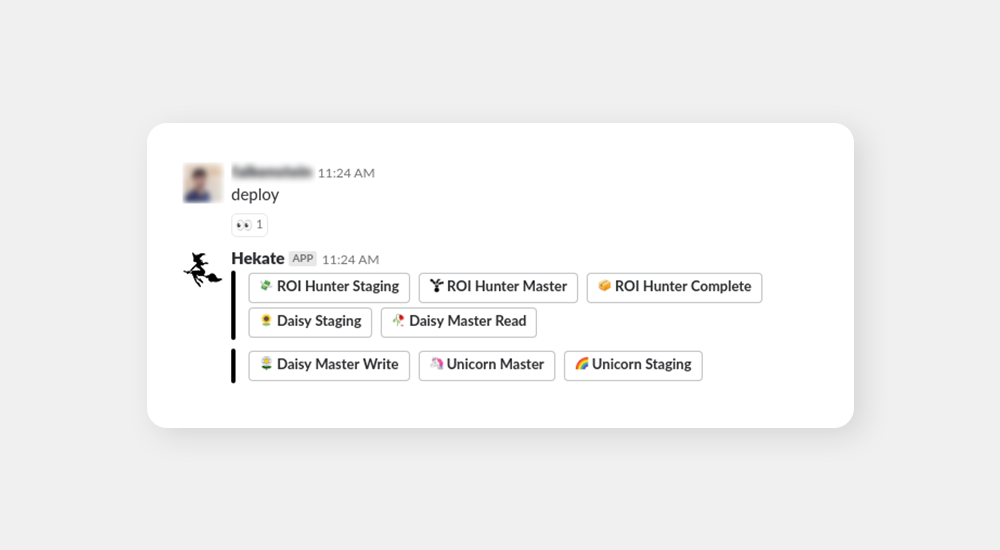
From here, you can set up your backend microservice that can do almost anything you can imagine. Our first chatbot commands were super simple. It was deploy staging and deploy master. When you typed deploy staging to the chatbot, the microservice behind the chatbot sent a request to Jenkins to remotely trigger a pipeline job.
I imagine you are still wondering why we called the chatbot Hekate. This one’s personal, as I’m a nerdy lover of Greek mythology and Hekate happens to be a rather mysterious goddess whose domain includes crossroads, I thought it was perfect for a microservice that manages “our crossroads” by choosing whether a blue or green instance of the app will be deployed. Unfortunately, the word “Hekate” also happens to mean “moan” in the Czech language which led my Greek-mythology-ignorant colleagues to believe I was compensating for something by writing the microservice. After a few rounds of explanations, I just gave up on the Greek mythical theme and went with plain witchcraft, with an icon to match:

Absolutely not compensating for anything, we kept coming up with more and more useful ideas. Hekate could help us with a lot more stuff than just with making deploys easier. Let’s take a look at Hekate’s available commands at the height of her glory.
Commands
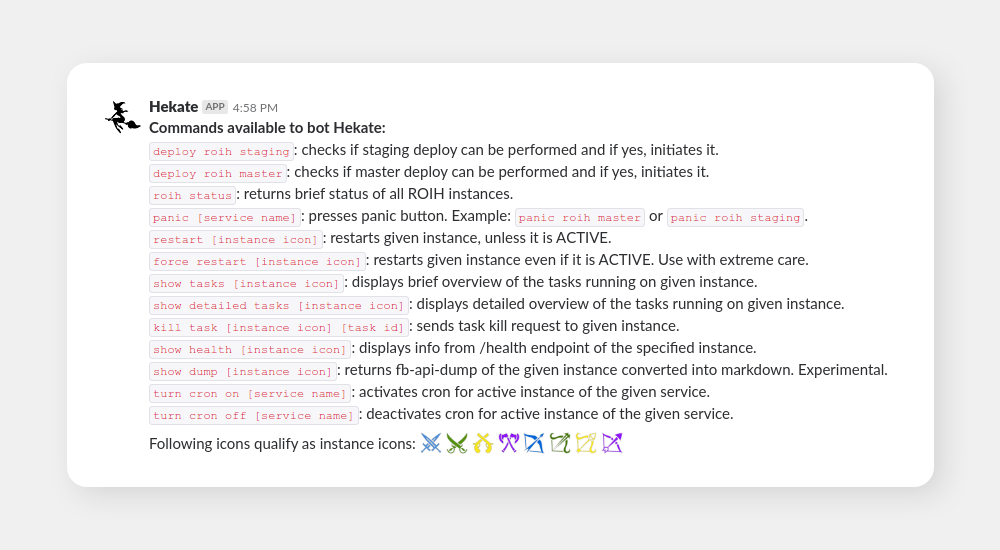
Above, you can see the previously explained deploy command. Then, the roih status command. After that command, Hekate scrutinized the status of our entire platform (all instances) and gave a detailed report. See below:
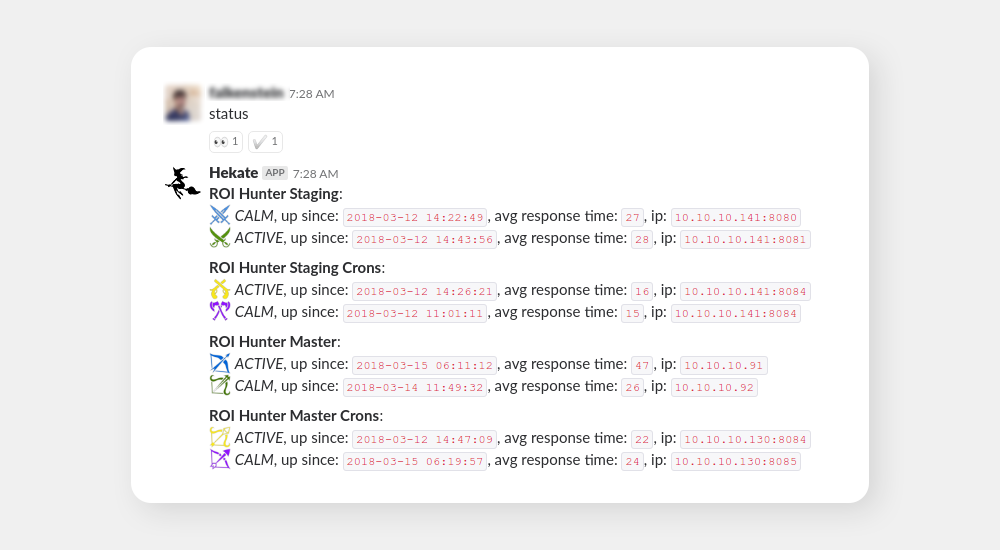
Note that I only mentioned blue and green instances before. Here, you can also see purple and yellow which are instances specified for cron because we eventually realized we need to separate these from our API instances. Also, there are instances for our staging platform. As for the icons, they are courtesy of game-icons.net and my general nerdiness.
This command proved infinitely useful over the years as it was our prime tool for determining momentary platform stability. You know, accidents sometimes happen, and knowing the state of the platform easily and immediately is the key to being able to solve them.
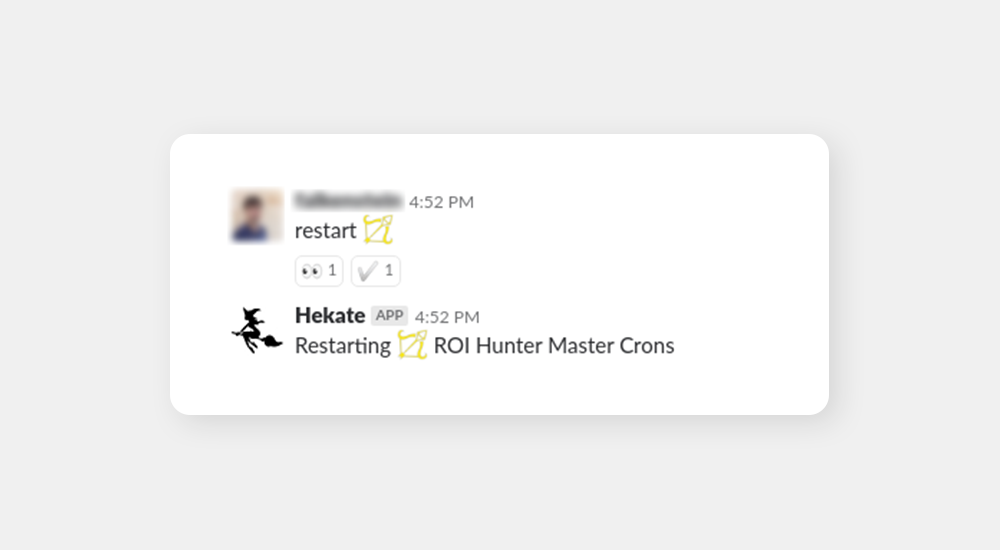
In the help output, you might have noticed that restart had two variants: restart and force restart. This is because restarting an instance is quite the nuclear option, something you don’t do every day. Slack chatbot, on the other hand, makes all our actions feel casual which is why we sensed potential danger and restricted the common restart only to instances that were currently inactive, not taking user traffic. Active instances, those under user traffic, could only be restarted with force restart. This defensive measure proved to be a good idea and we believe it is something everyone who’s writing a chatbot should keep in mind.
How to specify an individual instance
You could see that some commands work without parameter, i.e. status, panic or health. Many others require specified instance on which they should be executed. We developed three options for this specification.
The first option was very simple: you just wrote the name for the instance you wanted to specify. For example, you wrote show tasks master blue and you got the list of tasks currently running on the blue master instance. Many other alternatives would also have worked such as show tasks rh blue, show tasks blue rh, show tasks roi hunter blue, show tasks blue master roih hunter and many more. Hekate simply had a json config that listed all the possible terms she then looked up in the command string to decide which instance she was supposed to execute on. Eventually, we realized it would be nice to include more context in the specifications, so we expanded Hekate to work with commands such as show tasks master active, therefore, you no longer had to first find out which instance was currently active.
The second alternative worked in exactly the same way, only nerdier: you could replace instance names with the marvelous icons shown earlier.
The third specification option is the cool one. When configuring your application, there is another option to react to user’s behavior: Interactive Components.
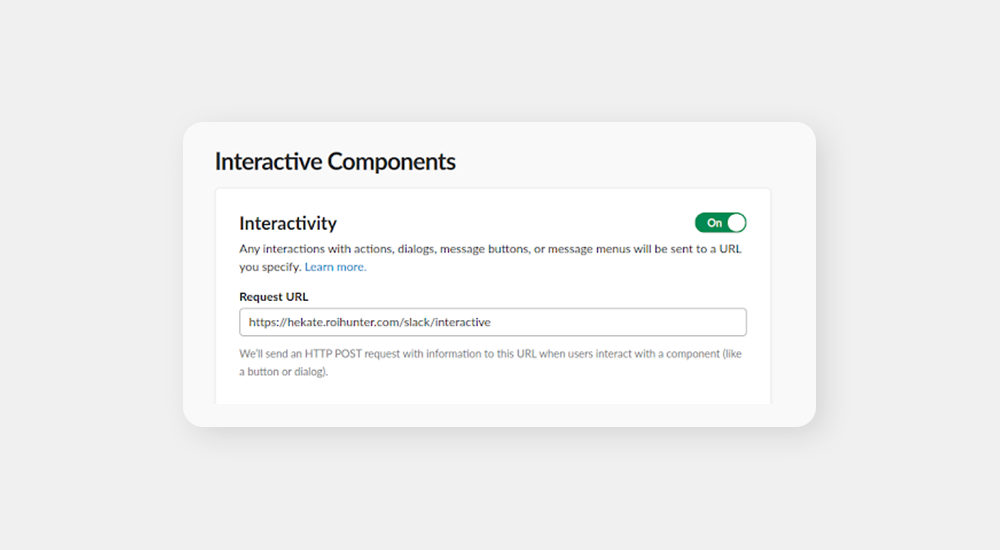
It’s pretty straightforward: you get a list of buttons, you click one, Slack sends a POST back to your app and you can react again. Needless to say, this is an amazing tool for specifications of an instance you want to execute your command on. See the below example:
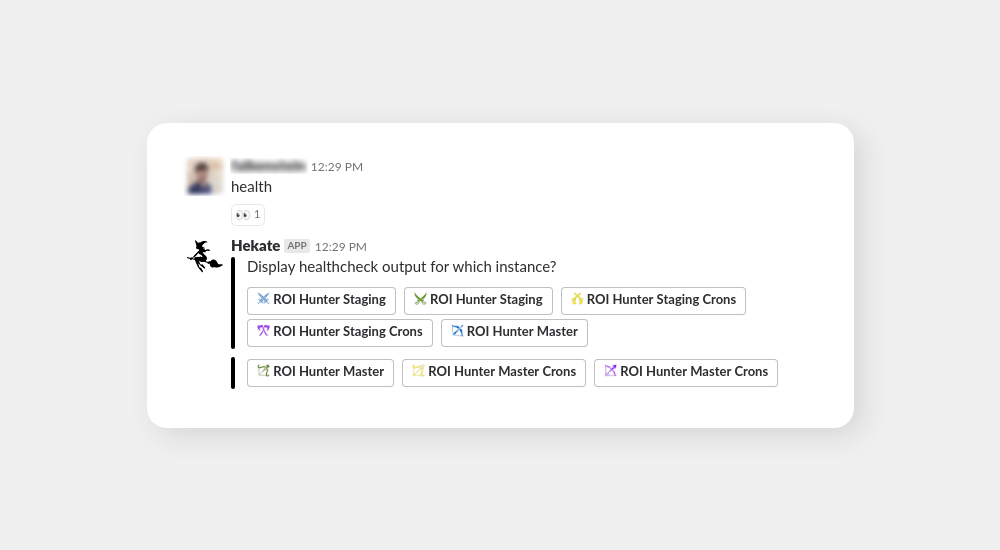
You just type health which is insufficient for Hekate as she understands you want to learn about health for a particular instance, but you didn’t tell her which one. Therefore, she offers you a list of buttons to pick which instance you want. After you click one of the buttons, Hekate gets the full information and responds with health for the desired instance.
This works like a charm for multiple reasons:
- it looks nice and is pleasant to work with
- it prevents human error, i.e. you just click the button, there’s no room for typos
- it nicely shows all the options and there is no need to look up the possible instances
- it is intuitive to work with. For example, you just type health and don’t have to worry about anything else
While I’d love to delve into the implementation details and show some code here, this article is already getting very long. This is something I can return to in the future. Of course, feel free to ask any questions. This is something we’d love to share.
Current state
Hekate
About a year ago, we moved our platform to Google Cloud. It had a massive impact on our infrastructure, Hekate included. To be more specific, most of Hekate’s commands instantly became obsolete.
While it might sound sad, it’s actually a very good thing because all of the stuff we used Hekate for is now happening automatically via Kubernetes in Google Cloud or is no longer needed.
The only command from above that is still operational today is deploy as it is easier to type a command in Slack than to click a pipeline in Jenkins.
However, we are still adding new commands. One example for all is toy. Each of our developers has his own toy database to play with on our internal toy server. These toy databases, however, tend to get very outdated and updating them to the state of our current master database used to be a complicated process that involved connecting to a few remote servers and running a few remote scripts. We simplified this by having Hekate do it for us. Now, all we need to do is type toy to Hekate and she will run all the scripts in the background for us. It’s a minor yet nice improvement to quality of a developer’s life.
Alerts
We have recently developed complex monitoring based around Prometheus. While the logs are very easily readable in Grafana, we also set up meaningful alerts into Slack. The alerts are split into multiple channels, therefore, our stats service Unicorn (our microservice naming is indeed mysterious) has its own alerting channel so that only some developers receive its common alerts. See an example of such an alert below:
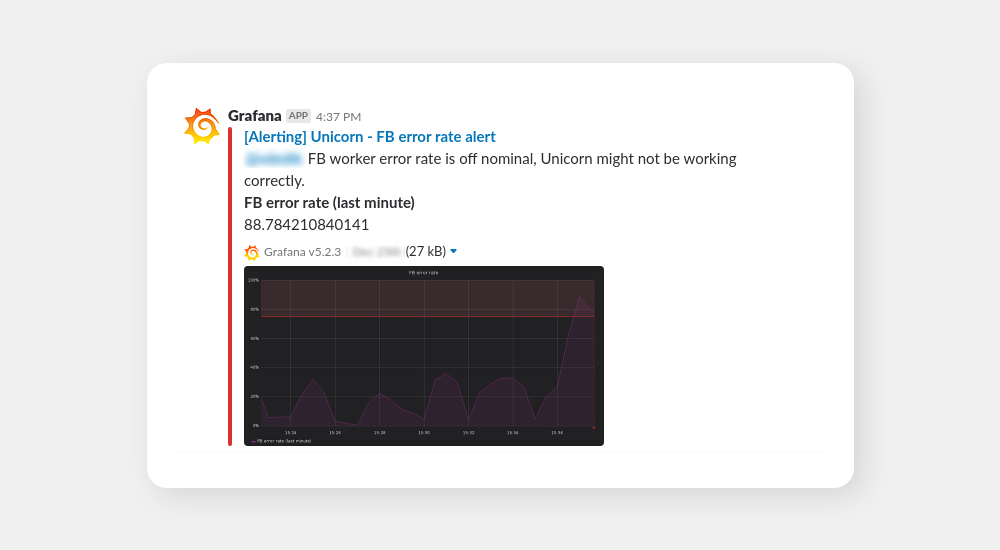
These alerts are only shown to the relevant developers as they are the ones who can efficiently act on them. Then, there are disaster-level alerts that are shown to the entire tech department so that they are solved as soon as humanly possible. Note that this didn’t happen overnight, it was more of a continuous process of setting up the alerts based on the experiences we had with Zabbix and Graylog earlier.
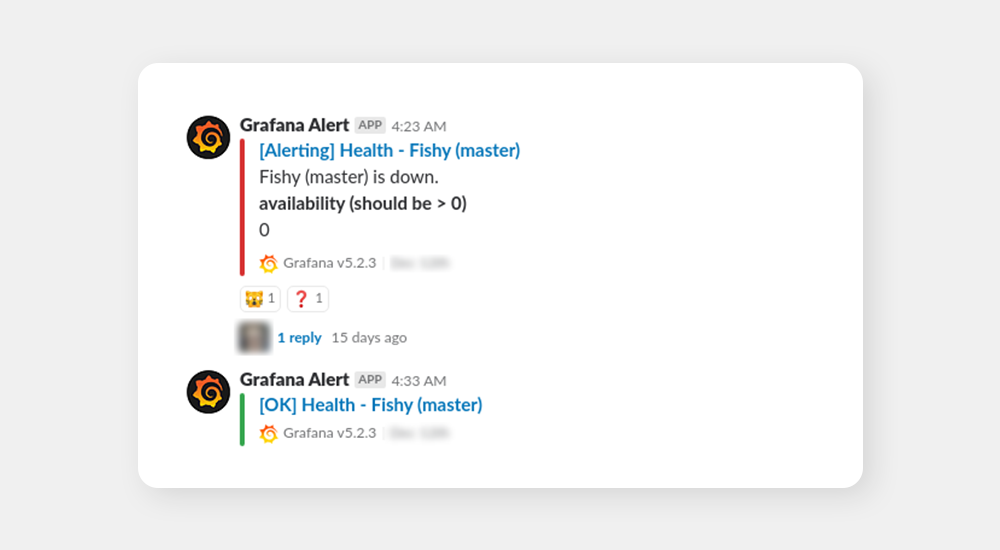
You can see that these alerts are clear, concise and show exactly what’s wrong (and also show that the situation is ok now). After a few years, our alerts are finally where we want them to be. This is courtesy of Grafana and years of experience with fine-tuning of alerts.
Notification channels
Nastenka: We have multiple microservices doing various things such as downloading data from third party APIs and pushing them into GSheets for analysis by our commercial teams. We set up channels where these microservices send a message every time they start or finish their job (the messages are sent via Hekate to avoid creating another Slack app).
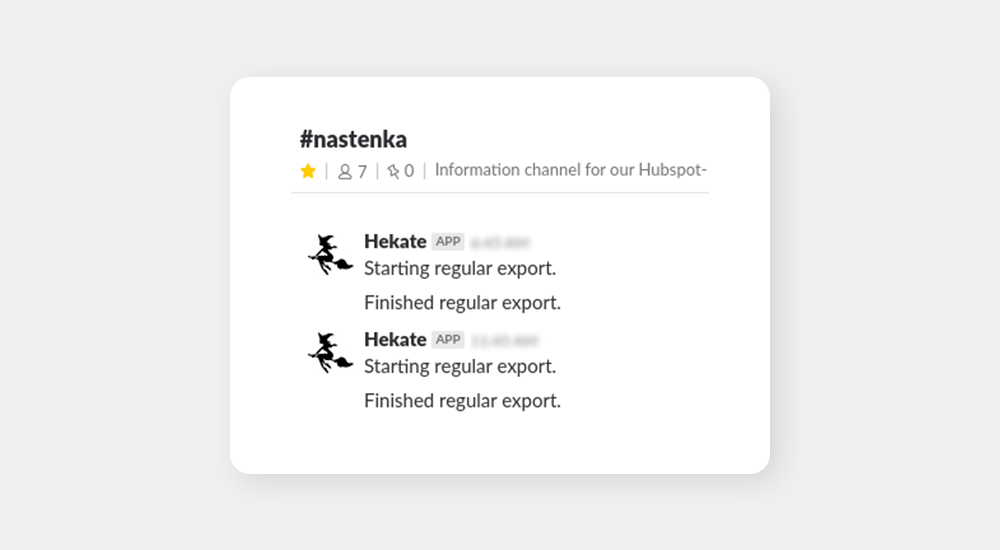
The whole point here is that when our commercial people aren’t sure whether the data they are working with are up to date, they just check the channel. Also, potential issues would show up in the channel, along with a notification to the responsible developer so that he can address the issue immediately. The issues are often on the side of the third party (Hubspot, in this case), which is the reason we’ll never be able to fully fix the issues and we need alerting tools such as this one.
On a side note, the service was named Nastenka after the famous character from the movie Jack Frost, which has a somewhat legendary place in our company’s culture.
Deploys: A few years ago, we set up a nice utility that lets us make very nice Slack-compatible releases and pushes them to Slack via Hunter-bot (that was actually before Hekate’s time). This little utility made our releases easily accessible for all people who are interested in them. Believe it or not, some people from commercial teams actively follow the channel and keep checking the releases to see what exactly is new in the app even though we frequently communicate the news in more human-friendly fashion.
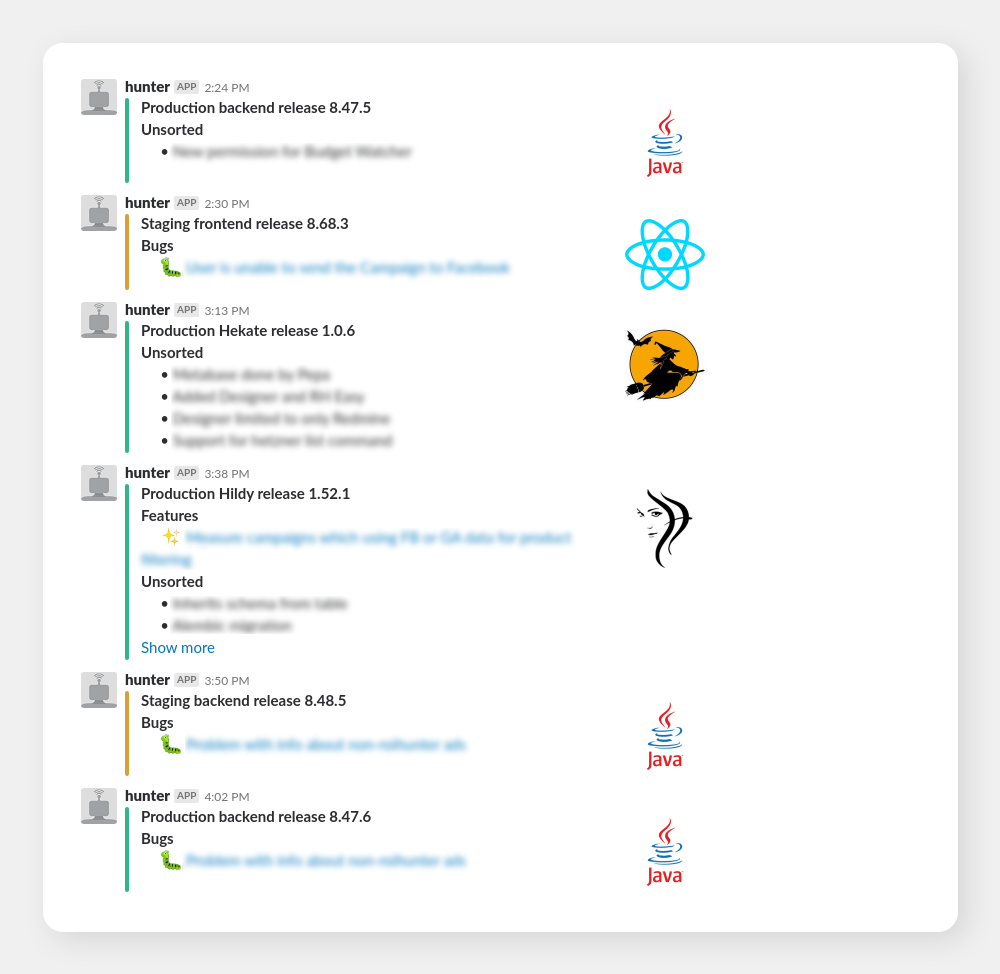
This overview’s usefulness extends beyond mere information. It also serves as a basic change tracking tool. When something breaks and we’re not immediately sure what, we can take a look at the recent releases and inspect the changes made which usually reveals the culprit very quickly.
Conclusion
We’ve shown a few ways how Slack integrations have made our jobs much easier. Still, we have just barely scratched the surface of the options Slack can offer us and we’re going to keep exploring them further. Given how well written and documented the Slack API is, it’s a very pleasant endeavor.
What is next? It’s hard to say. We’re adding new integrations or bot functionalities pretty much every week and some of the planned ones are pretty interesting (one of them is using Slack to create a “face game”, i.e. new employees learn to remember our faces via a game directly in the Slack API. We also plan to further expand our monitoring reports including reports about SLI.
Bright future? Yes. Another Slack article in the future? Most definitely.