
Motivation
Our application architecture consists of a core, also commonly called ROI Hunter, and multiple supporting microservices. Core itself serves as the gateway into our environment. It handles pretty much everything related to advertisements.
Customers create and manage their adverts via our API, which connects almost exclusively to the core. The core then sends requests to the microservices, if necessary.
The core also deals with activities that are not triggered by our users. These include the synchronization of advertisement objects from Facebook, running our automated rules, and many other calculations. This part of the application is commonly called the cron.
Long ago we used to run the core together on one server, i.e. one server handled both the API requests and the cron. As our architecture evolved, we realized it is better to keep these two apart, as the risks of them interrupting each other were too high. For example it happened once that the cron attempted to synchronize a huge amount of data, which reflected in delays on the API, so that users’ requests started to perform much slower.
Separating API and cron into two separate services helped us solve these issues nicely. To be honest, this is a much simplified story, in reality we have a far more complicated architecture.
Some time ago we migrated ROI Hunter into Google Cloud, which brought a lot of good stuff, but also forced us to implement limits to our resource consumption. Before migration to the cloud we didn’t have any such limits, because we owned a lot of servers, more than enough for our app. Now, in Google Cloud, we pay for the exact resource consumption, i.e. the costs for utilized resources started getting far more noticeable. As a result we started to put far more focus into this area.
In other words, we started to go through our app, looked for pieces of code that could be improved, and made them more efficient. We also realized our current monitoring tools (Graylog, Zabbix) were not enough. We needed something to clearly show us these weak spots.
One of our colleagues setup a brilliant Prometheus monitoring into Grafana, which includes how long it takes to call the endpoints on our API. This very nicely pointed out the weak spots and we set to work.
However, we also realized we have no such monitoring mechanism for our cron. We did some logging of how long particular cron jobs took to execute, but there wasn’t any easy way to utilize these outputs. As a result we came with opentracing.
What is opentracing
Quoting the opentracing project here: Distributed tracing is a method used to profile and monitor applications, especially those built using a microservices architecture. Distributed tracing helps pinpoint where failures occur and what causes poor performance.
For more info see the docs available here: https://opentracing.io/docs/
Jaeger
Besides the opentracing part, which handles instrumentation of the app and preparing the traces, we also needed a tracing system, i.e. a component that can take the traces and send them to a remote storage. For this we picked Jaeger, mostly due to the ease of its implementation.
Jaeger architecture looks as follows:
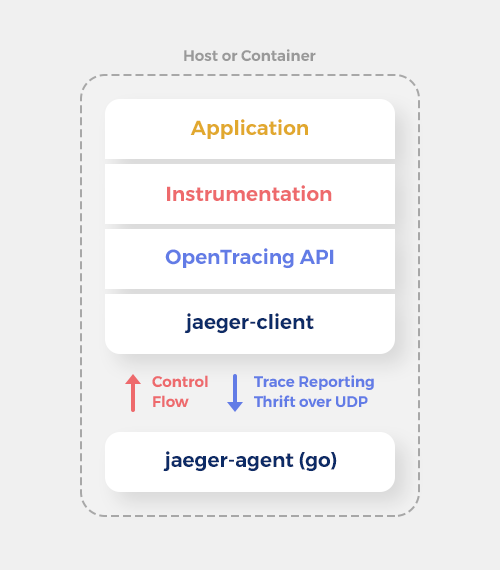
Only part of the image is shown here, as it’s the only one relevant to this article. At the bottom is jaeger-agent, which is the component that sends the traces for storage and analysis on another container. jaeger-client handles passing the data to jaeger-agent and it also contains the sampler (see below). Instrumentation is a crucial part in that it handles how OpenTracing gets “injected” into our app. As you’ll see below, we have customized the instrumentation to better suit our needs.
A very important component of Jaeger is the so called sampler. The sampler defines which traces will actually be sampled (=logged into remote storage).
There are three possible sampler configurations:
- const - either all traces are sampled or none is
- probabilistic - traces are sampled with a given probability, i.e. only a given percentage of traces is sampled
- rate-limiting - only allows a certain amount of samples per second
Both probabilistic and (to a lesser extent) rate-limiting configurations seem to be suited to huge projects that don’t care about particular traces, which isn’t our case.
We needed our tracing to be able to reliably capture a particular case, e.g. an attempt to extract a huge amount of data from our database which slows down the whole app. If probabilistic sampling left this particular issue out, it would be useless.
At the same time we didn’t quite want to instrument the whole application, as that would have caused a huge amount of traces that wouldn’t be interesting at all.
Tracing implementation
We found the middle ground in semi-manual implementation of tracing. We implemented our custom annotation (@Trace) that tells the opentracing module that the annotated method or class should be instrumented. With these we just configured const sampling, so that everything with the annotation is automatically sampled. This custom @Trace annotation means we’re actually doing manual customized instrumentation, which is exactly fine for us.
The annotation is based on Spring AOP. The @Aspect class behind looks as follows: 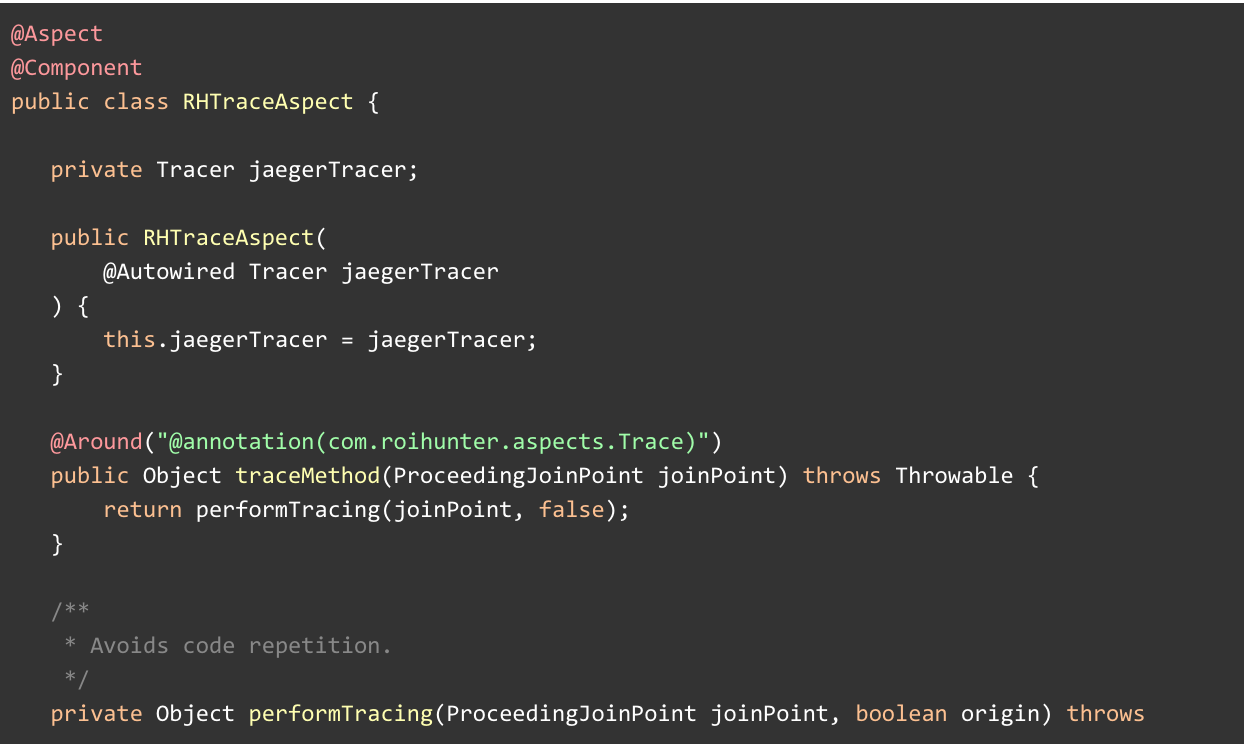
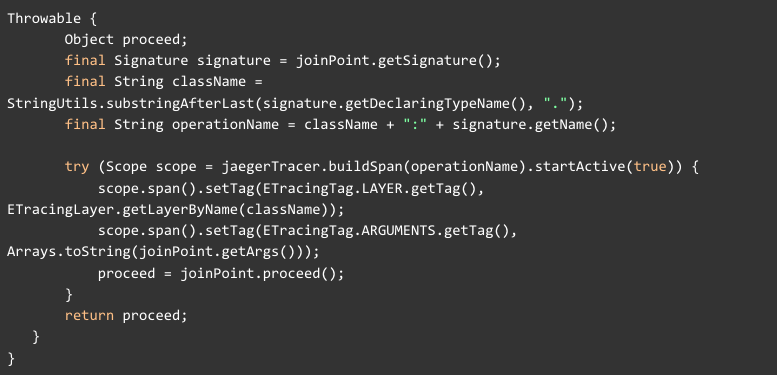
Note that the above class is heavily simplified to give the basic idea about the implementation without being unnecessarily confusing.
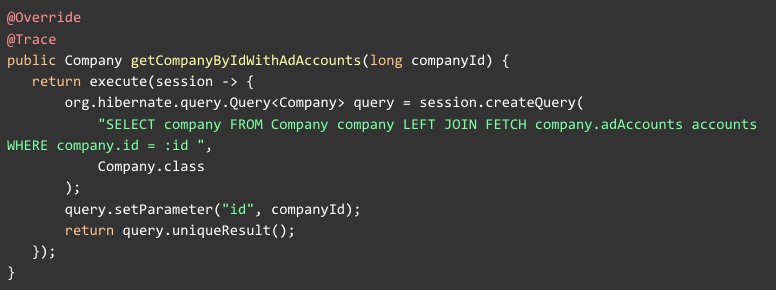
Practical example of our @Trace annotation usage:
This selective instrumentation has a few disadvantages. Firstly, only the annotated stuff gets traced. To explain it more closely: we have a @Service class A with public method M, where M is annotated with @Trace. Method M calls method N from @Service class B. Now the trace will go “deeper” into B.N if and only if N is also annotated with @Trace.
Thus, the consequence of our limits manually imposed upon opentracing is that we have to annotate all the important methods in our cron. It’s actually less of a setback than it might seem, and it helps us keep the Jaeger’s output nicely clear.
Benefits
Jaeger has already shown us quite a few weak spots in our app, some of which came as quite a surprise. For example we had a method that consisted of two parts:
- SELECT on all objects with a certain condition
- DELETE all the objects coming from above select
We knew from before that this particular cron was insanely slow, as we often saw it hanging in our logs. However, we always thought the DELETE part is the slow one, and focused our optimization efforts on it. One of the first outputs we got from Jaeger showed us that it was the other way around: SELECT took 99% of the time spent onthis cron.
We acted on this quickly and discovered the actual reason: the query wasn’t actually using index on the table from which it was selecting, which caused it to be insanely slow.
Another example: an issue was discovered when tracing showed us that there is one archaic method that takes several minutes (!) to execute in a transaction. It called SELECT to retrieve virtually all ads in our database (we have millions of them in there) and called UPDATE on some of them. The method was painfully inefficient, but also completely oblivious to us, because pretty much everybody totally forgot such a cron method existed.
The solution here was refreshingly simple: we deleted the cron.
The third example was synchronization of our data into Intercom. We are storing our data there per company and the synchronization was always pushing all the company data to Intercom at once. Needless to say, it’s far from efficient - the synchronization took almost an hour to finish. This was an issue, as it could, among other things, delay the shutdown of our cron when deploying a new version (when doing a deploy of a new cron, we wait for the old cron to finish its tasks before it shuts down).
The major optimization here was to spread the synchronization into a whole day by only retrieving a subset of companies for the synchronization - determined by a modulo function. Now each company takes less than a second to sync, i.e. we’ve essentially exchanged one very long process for many very short ones, thus removing the risks associated with having a long process running.
All three above examples and many others got fixed, because we finally knew for sure where to look. It was quite pleasing to watch that the maximum times in Jaeger slowly dropped from tens of minutes down to tens of seconds, and even these are now rare.
However, it revealed another phenomena. In ROI Hunter we have a few customers who are very taxing on our architecture. When there is a cron process that takes a long time (=more than a few seconds), it almost always comes from these few customers. These are the clients who have huge amounts of ads, focus on a certain functionality of ROI Hunter etc.
Our tracing outputs have pointed us towards just how demanding these clients really are on our resources. Granted, it still shows us there is a lot of room for improvement in our code, but it also tells us that we might want to employ non-technical measures as well, i.e. to educate our clients on how to use our platform most efficiently, which saves both their time and our resources.
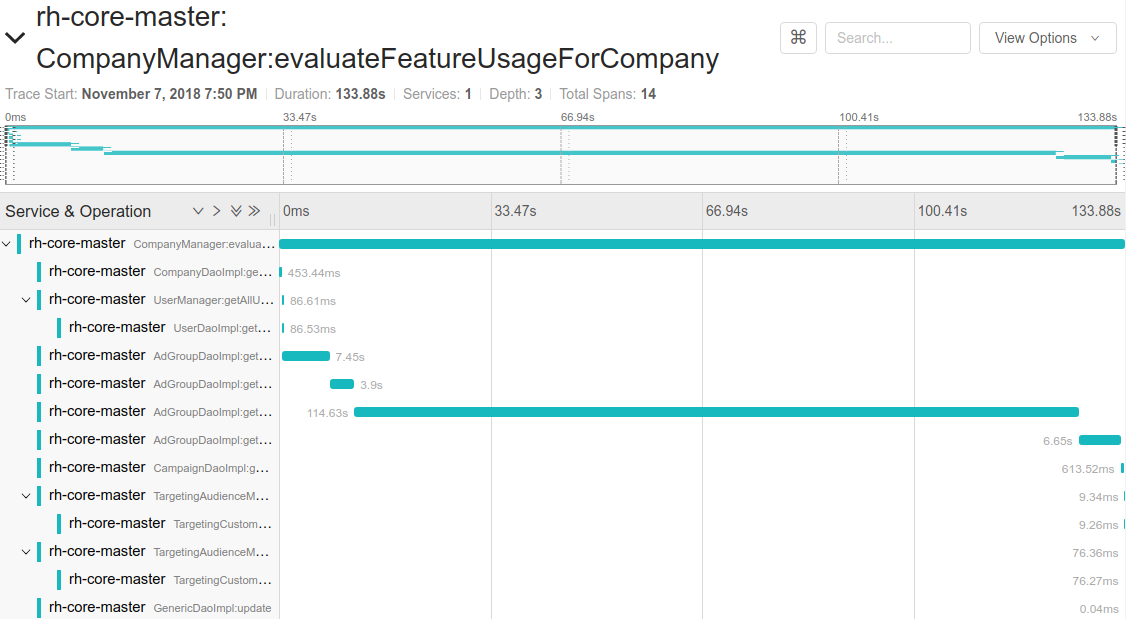
Example of a tracing output for a massive client
Conclusion
We implemented opentracing in a very limited form, but that was on purpose. In our opinion the outputs have more than paid off and we believe that this little known tool deserves more usage.