
Volume II: How marketing can elevate markups during the Christmas season
The Christmas season is ahead of us. This is a unique opportunity for retailers to finally sell products with solid markups (amount added to the cost price of goods to cover overheads and profit).
Unfortunately, we often find that retailers aren’t optimising profits because part of their inventory sells out quickly for a suboptimal price and another part of their inventory sits idle in a warehouse waiting to be sold with massive markdowns after the holiday season.
Why is this? Common retailing knowledge says that price influences demand - meaning if you offer a product for a cheaper price, you will sell a larger quantity of that item.
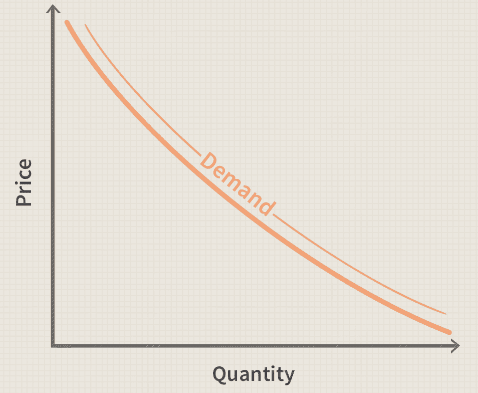
This theory rings true in an offline environment, but modern e-commerce empowered by dynamic ads has changed the rules of the game. Now demand is also a function of the marketing spend focused on a given product.
This is the beauty of e-commerce - in a traditional brick-and-mortar store, your ability to get a certain number of people to see a certain product is limited by your foot traffic and merchandising efforts.
However, in an online environment, you can dynamically influence which products are promoted across Facebook, Google, and other networks, and essentially purchase traffic on any product you need – thanks to dynamic ads.
Earn more by increasing demand instead of implementing markdowns
This strategy is very successful, especially in the fashion vertical, where customers can’t easily find the same product for a cheaper price using price comparison websites, and where markdowns usually only worsen profits (this is why Zara rarely offers discounts and only does so for specific products).
It’s surprisingly easy for marketing to employ a strategy where every single SKU truly achieves its potential. However, it means a bit of change in approach where marketing is not viewed as just a supporting role for the commercial team, but as an essential strategic partner.
Step-by-step guide on how to leverage marketing to elevate e-commerce margin:
We have prepared an example data set to guide you through this process. Feel free to use it to have conversations with your peers or managers.
The goal of this example is to explore how you would use the data for your business. Here is the link to the data set.
- First, have a look at what portion of spend goes into discounted products vs full-priced products.
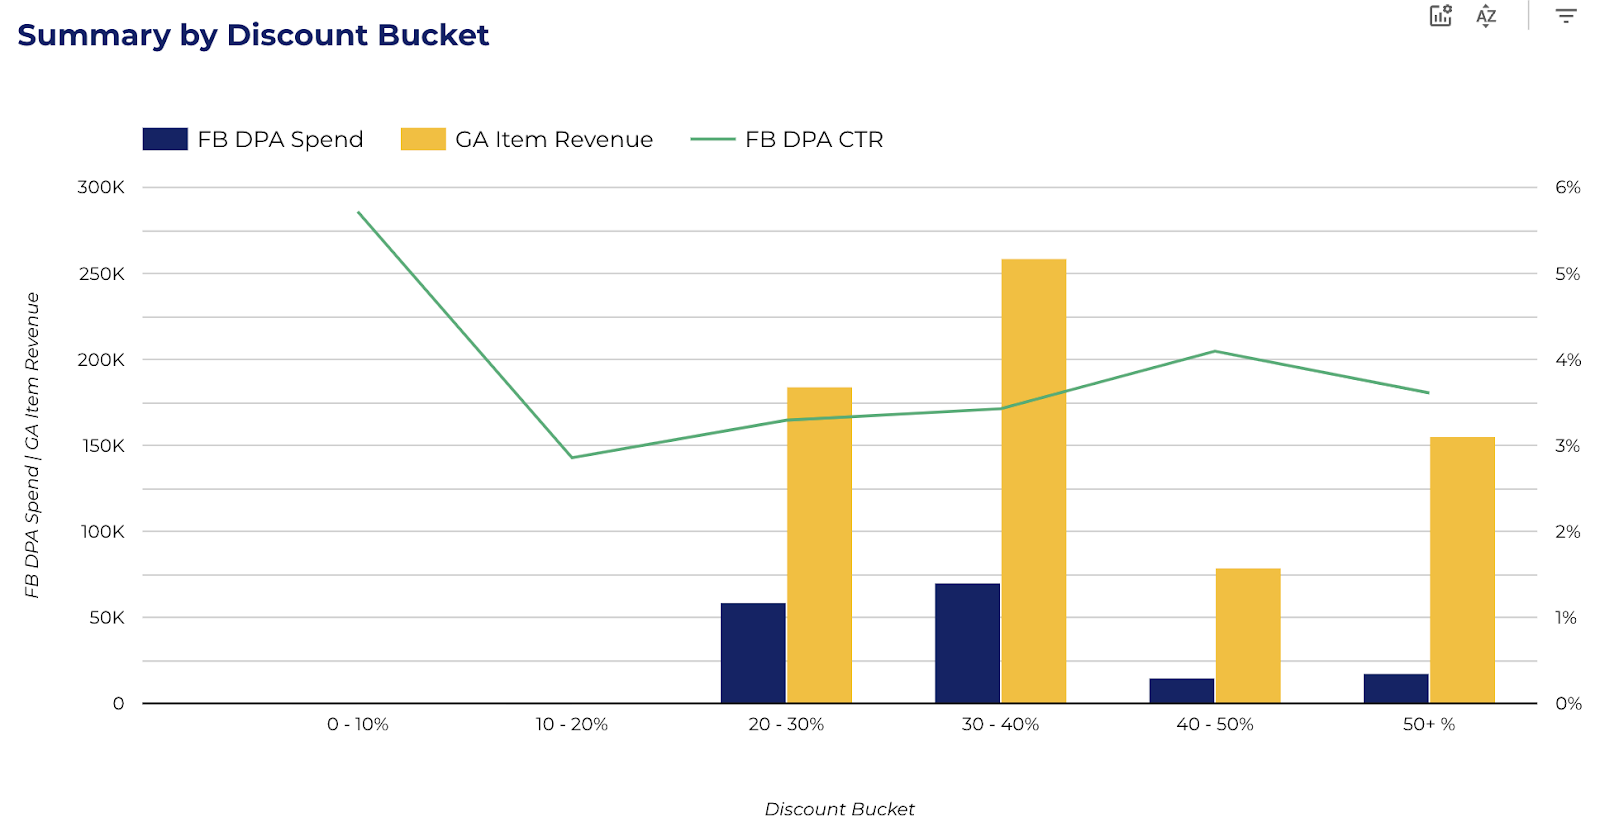
The chart below shows what amount of dynamic spend on Facebook goes to different buckets of products based on their discount, and how it correlates with the revenue from products in a given bucket from Google Analytics.
Usually our clients are surprised when they see this breakdown applied to their data, because they realise that the vast majority of their spend is going solely to discounted products.
The reason is that Facebook and Google algorithms tend to prioritise discounted products because it’s easier for them to achieve conversions/revenue with these items. - It’s okay to promote discounted products, but as the markup on these products is lower than full-priced products, discuss with your commercial team what ROAS your business can afford for discounted products and for full-priced products.
- Once you have different ROAS buckets, tier different discount buckets as separate product sets for your Facebook and Google campaigns. Bid/budget every campaign differently based on your required ROAS.
This way, you can ensure that full-price products will be prioritised over discounted products, (which is the overall goal). - Report back the ad spend and ROAS on a product level to your commercial team (you can scroll down to see product-level data in the sample data set).
As you can see in the example below, the black trousers generated slightly higher revenue (6.978 EUR in GA Item revenue) than the white dress. If your commercial team only uses sales data, they might think that the black trousers are better and order more of them or discount the white dress.
But once you see the aggregated marketing push behind the SKU (in this case, it’s FB DPA spend), it shows a completely different picture, as there’s 2x more marketing spend behind the black trousers.
This is a perfect example of how product performance data can be a game changer for the way marketing cooperates with the rest of your organisation. - Also discuss where the spend is allocated in terms of categories and brands at your weekly commercial team meeting.
You can use this aggregated data from all the dynamic campaigns on Facebook and Google (Facebook dynamic product ads or Advantage+ and Google Performance Max or Google Shopping).
We usually find that more than 50% of retailers’ overall marketing budget is driven by dynamic campaigns. However, retailers still don’t know which products the algorithms spend their money on. Such a report can shift discussion from “The marketing team is doing crap work or the products are sh*t,” to “Are we promoting the right categories/brands?”


Food for thought
It might seem like a lot of work to put the data model together.
We have seen many data-lake projects that are trying to associate ad spend on the SKU level using manually created static ads. These kinds of projects are usually lengthy and fall apart in terms of actionability. This is why we strongly recommend using dynamic ads.
With dynamic ads, you’ll be surprised at the level of control you have, not only in terms of which products get promoted, but also in how the visual creatives for your product look (e.g. using additional images to apply lifestyle photos).
That’s all for the second volume. Feel free to post here with questions, or reach out to me directly if you want to see how the data model looks with your data.
Wishing for you to get the most out of this upcoming Christmas season!

.png)